
I’ve spent many late nights switching back and forth trying to correlate a packet in Wireshark with an event log entry while referring to a log file. Wouldn’t it be nice to have a single pane of glass to look at all these manage all these sources of information?
Look no further, Microsoft Message Analyzer is here!
More than a Replacement for Network Monitor
You probably remember some years ago Microsoft had their Network Monitor tool to perform packet captures. It was a confusing mess and generally not very good. Then along came Ethereal, a very powerful packet capture and analysis tool. You know it today as Wireshark, the go-to solution for network capture and analysis. I’ve used Wireshark with success for years.
So when I saw the announcement of Microsoft Message Analyzer, I didn’t give it much mind. I dismissed it due to a combination of it being billed as the “Successor to Microsoft Network Monitor” and I was already comfortable with Wireshark.
Little did I know this tool can do so much more. Message Analyzer can not only capture traffic and read captures (including Wireshark’s .pcapng format), it can analyze information from a whole host of other sources. These sources include: Windows event logs, *.log files (such as netlogon.log), PowerShell, SQL and Azure.
Looking Around the Interface
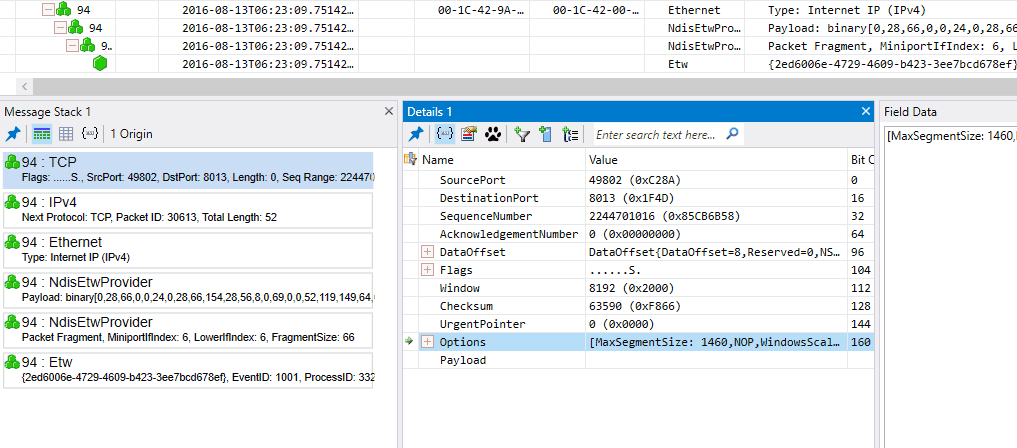
The foundation of data in Message Analyzer is the “message.” A message can be anything from a captured packet or frame to an event from Event Viewer. Messages can be combined or “stacked” into sessions and conversations. For example, here’s a message stack from a TCP packet:
Now, look at what happens when all the messages in the stack are expanded:
Check out the “Module” column. You are taken through the entire communication hierarchy. You have a message for the TCP conversation, the IP packets, the Ethernet frames, even the binary. You can also set up other “views” to get more detail for every message in the stack.
You can review the entire message stack in order, the details of message, and data for each field. Things get even better when there is a back and forth between two hosts.
The blue icon indicates there is a two-way conversation. The sub message stacks drill all the way down to binary data.
The number of views and layouts is too much to cover. You can reach out to us if you have questions about this.
Remote Captures
Starting with Windows 8.1/2012 R2, the capture driver for Message Analyzer is baked in to Windows OS. This means that proper WinRM configuration, you can capture from a remote machine. Even better, you can capture from multiple machines simultaneously!
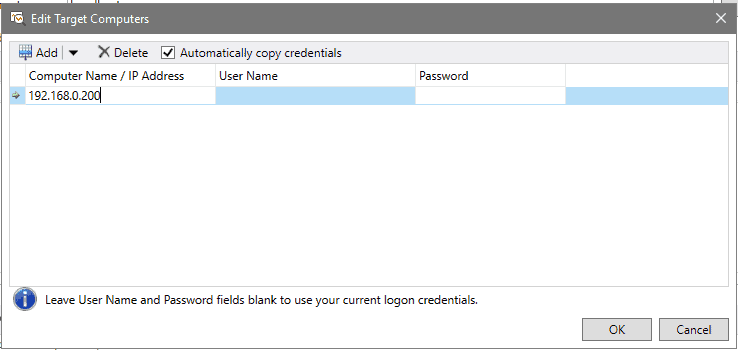
When starting a new live trace, you can edit the target computers and enter the name or IP of the computer(s) you wish to capture from.
Easy Decryption
In today’s world encryption is king. Nearly everything is encrypted. This makes our job harder as we’re trying to see what no one wants to be seen.
Under Tools > Options, you can import a server side SSL certificate and decrypt all the data.
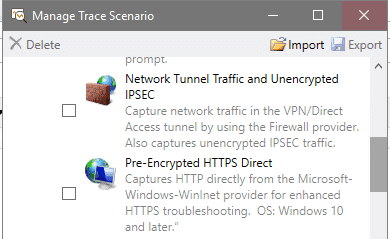
OR, you can just select another scenario for your capture. Options include capturing at the Windows Firewall level before local IPsec encryption or at the application before being encrypted by HTTPS.
Built-In Intelligence and Multiple Scenarios
Catching IPsec and HTTP traffic before encryption is just the beginning. There are traces/captures you can do to troubleshoot SMB directly, USB and Bluetooth. During the trace set up just select the desired trace scenario (there are currently 21) and you’re off.
Additionally, Message Analyzer intelligently checks the message for errors, warnings or anomalies.
You can select views to provide you with the information you want to see. There are views that allow you to see the timing of the packets, the response, even the process name and kernel module.
Putting it All Together
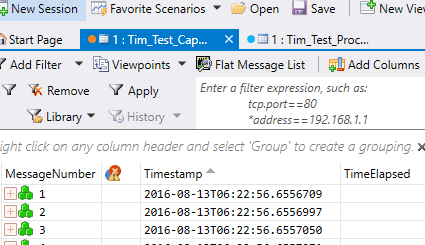
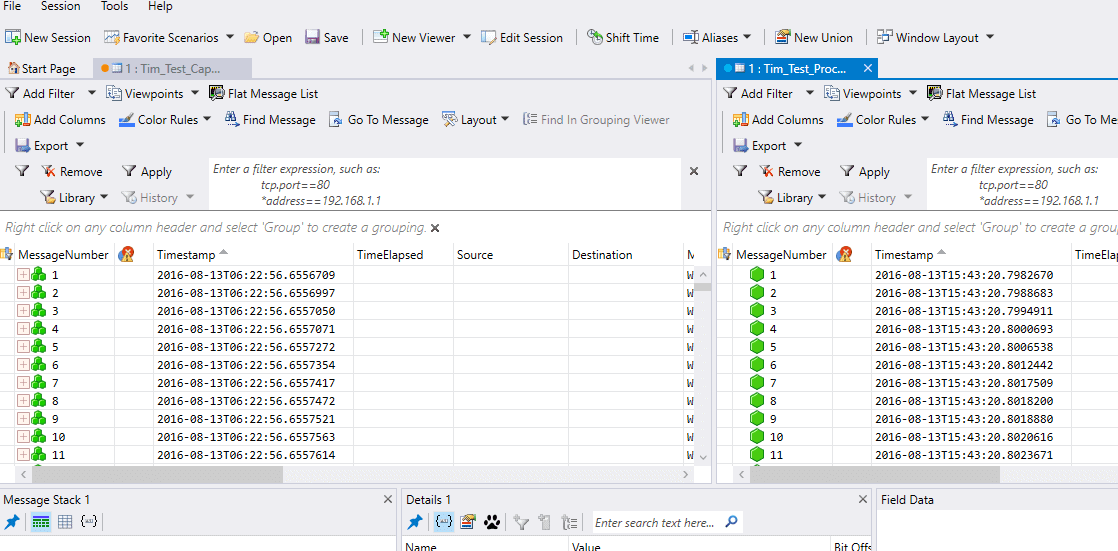
Finally, you make Message Analyzer your “one pane of glass” for troubleshooting with multiple data sources. You can open data sources in separate analysis grids:
You can place them side by side:
Conclusion
There are so many possibilities for this tool it is essential for your IT bag of tricks.
For more information:
- Microsoft Message Analyzer on TechNet
- Microsoft Message Analyzer Operating Guide on TechNet
- Message Analyzer tutorials on YouTube


